How to Size a Wind Turbine From Your Factory Electricity Bill in Pakistan
For wind turbine for factory in Pakistan, the electricity bill is one of the best places to start sizing a commercial wind turbine—but it is not enough to make the final selection.
A bill can tell us how much electricity the factory buys, its billing demand, tariff category, and in many cases peak/off-peak consumption. It cannot tell us how much wind exists at the factory, what a turbine will produce at the proposed hub height, or whether that production will occur when the factory needs electricity.
That distinction matters.
A factory consuming 100,000 kWh per month should not automatically buy a turbine whose theoretical monthly output is 100,000 kWh. Wind turbines do not operate continuously at rated power.
The correct process is:
Electricity Bill → Annual kWh → Factory Load Profile → Wind Resource → Turbine Power Curve → Annual Energy Production → Hourly Load Matching → Final Turbine Size → Financial Analysis
This guide explains that process for Pakistani businesses considering approximately 10 kW to 1 MW commercial wind systems.
For a broader introduction to industrial wind projects, also read Wind Turbines for Business in Pakistan: 100 kW to 1 MW Guide and the location-specific Wind Turbine for Factory in Karachi guide.
1. The First Mistake: “My Factory Load Is 200 kW, So I Need a 200 kW Wind Turbine”
This sounds logical but is technically incorrect.
Suppose a factory has a maximum electrical demand of:
200 kW
That does not mean it continuously consumes 200 kW.
Its actual demand might look like this:
For Example
| Time | Factory demand |
|---|---|
| 1:00 AM | 45 kW |
| 6:00 AM | 60 kW |
| 9:00 AM | 160 kW |
| 12:00 PM | 185 kW |
| 3:00 PM | 200 kW |
| 7:00 PM | 130 kW |
| 11:00 PM | 55 kW |
Now consider a 200 kW wind turbine.
It also does not continuously produce 200 kW.
Depending on wind speed, its output might be:
| Time | Factory Load | Turbine Output |
|---|---|---|
| 1:00 AM | 45 kW | 120 kW |
| 6:00 AM | 60 | 170 |
| 9:00 AM | 160 | 40 |
| 12:00 PM | 185 | 80 |
| 3:00 PM | 200 | 150 |
| 7:00 PM | 130 | 190 |
| 11:00 PM | 55 | 100 |
The factory demand and wind generation are two changing curves.
Therefore:
A commercial turbine must be sized from energy demand and generation profiles, not from one kW number on the electricity bill.
2. Understand What Your Pakistan Electricity Bill Is Telling You
Before looking at wind turbines, collect at least 12 consecutive months of electricity bills.
Depending on the customer’s tariff and supply arrangement, useful information can include:
- units consumed in kWh;
- peak units;
- off-peak units;
- maximum demand;
- sanctioned/connected load;
- tariff category;
- fixed/demand charges;
- variable energy charges;
- taxes, duties and surcharges;
- billing period.
3. kW and kWh: The Most Important Difference
Factory owners often use the two terms interchangeably.
They are not the same.
kW = Power
This tells us the rate at which electricity is being consumed or produced at a particular moment.
A factory operating at:
300 kW
is drawing electrical power at that rate.
kWh = Energy
This tells us how much electricity is consumed over time.
If the factory operates at 300 kW for 4 hours:
For wind-turbine sizing:
kW tells us the size of the machine. kWh tells us how much useful electricity the business needs and how much the turbine actually generates.
For investment decisions, annual kWh is usually much more informative than rated kW alone.
4. Step One: Calculate the Factory’s Annual Electricity Consumption
Take the last 12 bills.
Suppose a factory’s monthly consumption is:
| Month | Electricity Consumption |
|---|---|
| January | 82,000 kWh |
| February | 79,000 |
| March | 91,000 |
| April | 96,000 |
| May | 108,000 |
| June | 115,000 |
| July | 120,000 |
| August | 117,000 |
| September | 106,000 |
| October | 98,000 |
| November | 89,000 |
| December | 84,000 |
| Total | 1,185,000 kWh/year |
The factory therefore purchases approximately:
from the grid in this simplified example.
Now we have a useful starting number.
But we still cannot select the turbine.
5. Calculate the Factory’s Average Electrical Load
Annual energy can be converted into average load:
For our example:
So although the factory might have a maximum demand of perhaps 250 or 300 kW, its year-round equivalent average load is only:
This is useful information.
But it still does not mean:
Buy a 135 kW wind turbine.
Why?
Because both factory demand and wind generation change throughout the day and year.
6. The Electricity Bill Gives You Three Different Sizing Clues
A good feasibility study separates these.
| Bill information | What it tells us | Can it directly determine turbine size? |
|---|---|---|
| Annual kWh | Total factory energy requirement | No, but extremely useful |
| Maximum demand kW | Highest electrical demand | No |
| Peak/off-peak kWh | When some consumption occurs | Helps significantly |
| Monthly kWh | Seasonal demand variation | Helps |
| Tariff | Financial value of displaced grid energy | Needed for ROI |
The bill answers:
How much electricity does the factory use?
The wind study answers:
How much electricity can a turbine produce here?
The project design must connect those two answers.
7. A Useful First Screening Formula
At the earliest stage, we can estimate what rated turbine capacity might be required to generate a target amount of annual energy:
Suppose our example factory uses:
and initially wants wind energy equal to 30% of its annual consumption.
Target:
Now look at different hypothetical capacity factors.
At 20% CF to 40% CF
Look at what happened:
| Assumed CF | Turbine capacity needed for 355,500 kWh/year |
|---|---|
| 15% | 271 kW |
| 20% | 203 kW |
| 25% | 162 kW |
| 30% | 135 kW |
| 35% | 116 kW |
| 40% | 101 kW |
The same factory bill can point toward anything from approximately 100 kW to 270 kW, depending on the site’s wind performance.
This is exactly why a turbine cannot be sized from the electricity bill alone.
8. What Is Capacity Factor?
Capacity factor compares actual annual production with the energy the turbine would generate if it operated at rated output continuously for all 8,760 hours.
For example, if a 100 kW turbine generates:
then:
A 25% capacity factor does not mean the turbine continuously generates 25 kW.
The turbine could move between:
0 → 15 → 40 → 80 → 100 kW
throughout the year.
Capacity factor simply describes the resulting annual energy relative to the theoretical maximum.
9. What Different Turbine Sizes Could Generate
For initial screening, capacity-factor sensitivity is useful.
Annual energy — mathematical scenarios
| Turbine | 15% CF | 20% CF | 25% CF | 30% CF | 35% CF |
|---|---|---|---|---|---|
| 10 kW | 13,140 | 17,520 | 21,900 | 26,280 | 30,660 |
| 20 kW | 26,280 | 35,040 | 43,800 | 52,560 | 61,320 |
| 50 kW | 65,700 | 87,600 | 109,500 | 131,400 | 153,300 |
| 100 kW | 131,400 | 175,200 | 219,000 | 262,800 | 306,600 |
| 200 kW | 262,800 | 350,400 | 438,000 | 525,600 | 613,200 |
| 250 kW | 328,500 | 438,000 | 547,500 | 657,000 | 766,500 |
| 500 kW | 657,000 | 876,000 | 1,095,000 | 1,314,000 | 1,533,000 |
| 1 MW | 1,314,000 | 1,752,000 | 2,190,000 | 2,628,000 | 3,066,000 |
Important: these are calculations, not production forecasts for Pakistan.
You cannot look at this table, choose 30%, and order a turbine.
The actual capacity factor must ultimately come from the site wind resource + selected turbine power curve + project losses.
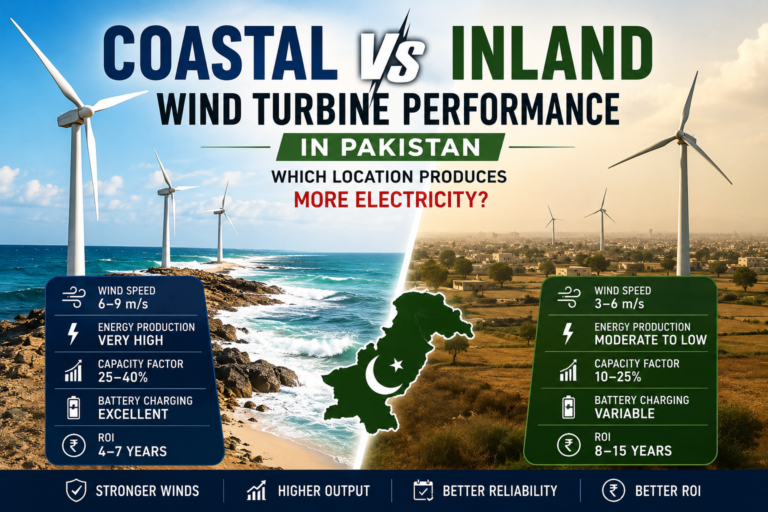
10. Pakistan Has Real Wind Resources—but Location Matters
There is strong evidence for wind energy in southern Sindh.
The Sindh Energy Department identifies the Gharo–Keti Bandar wind corridor as approximately 60 km wide and more than 180 km long, covering areas including Thatta, Badin, Jamshoro, Hyderabad and Tharparkar. The department states exploitable wind-generation potential above 60,000 MW. (SINDH ENERGY DEPARTMENT –)
Pakistan also has substantial operational utility-scale experience. PPIB’s commissioned portfolio, current to 30 June 2026, includes numerous operational wind projects, while its CPEC portfolio identifies projects such as the 100 MW UEP Wind Farm and several 50 MW projects in Jhimpir and Gharo/Thatta. (Private Power & Infrastructure Board)
But this does not mean every factory in Karachi, Hyderabad, Jamshoro or Thatta should use the same capacity factor.
A factory surrounded by warehouses can have very different turbine inflow from an open wind-farm site.
For location-specific commercial discussion, see Wind Turbine for Business: Karachi to Hyderabad Commercial Guide.
11. Don’t Copy the Capacity Factor of a Nearby Wind Farm
This is an important warning.
Suppose a utility-scale wind farm near your factory has excellent performance.
You cannot simply say:
“Their capacity factor is X%, so ours will also be X%.”
Utility turbines may have:
- much larger rotors;
- taller towers;
- better exposure;
- different power curves;
- professional micro-siting;
- less building turbulence;
- different control systems;
- different availability.
The correct calculation for the factory remains:
not:
12. Use the Factory GPS Coordinates
After analysing the electricity bill, the next required input is the exact factory location.
Not simply:
Karachi.
Or:
Jamshoro.
We need coordinates such as:
Latitude, Longitude
because regional wind conditions can change significantly with:
- distance from coast;
- terrain;
- elevation;
- surrounding development;
- surface roughness;
- proximity to obstacles.
For an initial site check, WindTurbine.pk provides a dedicated Wind Turbine Feasibility service.
13. Use Trusted Wind Resource Data for Initial Screening
For Pakistan, one useful independent source is the Global Wind Atlas, developed through a partnership involving DTU Wind Energy and the World Bank Group. The World Bank describes it as a tool intended to help planners, policymakers and investors identify high-wind areas and perform preliminary calculations. (World Bank Data Catalog)
The World Bank also publishes Pakistan-specific wind-speed, wind-rose and wind-power-density map datasets derived from the Global Wind Atlas. (World Bank Data Catalog)
World Bank — Pakistan Wind Speed and Wind Power Potential Maps
These are excellent screening resources.
But a map is not a replacement for a site measurement campaign for a large investment.
The World Bank’s Pakistan wind-resource mapping programme itself involved mesoscale modelling as part of a broader resource-mapping effort, illustrating the difference between national/regional resource assessment and project-level measurements. (The World Bank Docs)
14. Why Hub Height Must Be Considered
Suppose the wind resource at:
10 m = relatively weak
but the resource at:
50 m = significantly stronger.
A factory owner looking only at ground-level wind might reject a potentially useful site.
The reverse problem also occurs.
Someone feels strong wind on a roof and assumes a large turbine will perform well.
But rooftop wind may be highly turbulent.
For commercial projects, the wind should be assessed close to the proposed turbine hub height, not simply at human height.
15. Now Obtain the Actual Turbine Power Curve
This is where turbine sizing becomes much more accurate.
The power curve shows turbine electrical output at different wind speeds.
For example, a hypothetical 100 kW turbine might behave like this:
| Wind Speed | Example Output |
|---|---|
| 2 m/s | 0 kW |
| 3 m/s | 1 kW |
| 4 m/s | 5 kW |
| 5 m/s | 14 kW |
| 6 m/s | 28 kW |
| 7 m/s | 48 kW |
| 8 m/s | 70 kW |
| 9 m/s | 88 kW |
| 10 m/s | 98 kW |
| 11 m/s | 100 kW |
| 12 m/s | 100 kW |
These numbers are illustrative only.
Do not use them to predict a real 100 kW turbine.
The international reference for power-performance measurement is IEC 61400-12-1:2022. It specifies procedures for measuring turbine power performance and requires measured power curves and derived energy-production figures to be accompanied by assessment of measurement uncertainty. (IEC Webstore)
IEC 61400-12-1:2022 — Wind Turbine Power Performance
When buying a commercial turbine, ask the supplier:
Is the power curve measured or simulated?
Which standard was used?
At what air density?
Is there a third-party test report?
Does the report belong to this exact turbine model?
16. Why Cut-In Wind Speed Can Mislead Buyers
A supplier might advertise:
Cut-in wind speed: 2.5 m/s
That sounds impressive.
But cut-in only means the turbine begins operating or producing measurable power around that wind speed under defined conditions.
It does not mean it produces useful rated power at 2.5 m/s.
A 100 kW turbine might produce only a tiny fraction of its rating near cut-in.
For a factory, ask:
How many kW does the turbine produce at 4, 5, 6, 7 and 8 m/s?
That is much more useful.
17. The Correct AEP Calculation
Once we have hourly wind data and a credible power curve, we can estimate annual energy production.
For every hour:
where:
= wind speed during hour
and:
= turbine power curve.
Then:
for one-hour data.
This gives gross Annual Energy Production before appropriate project losses.
That is the number that begins connecting the wind study with the electricity bill.
18. Why Hourly Wind Data Beats Annual Average Wind
Imagine two sites both have:
Average wind = 6 m/s
Site A
Wind stays between approximately 5 and 7 m/s for many hours.
Site B
Many hours are low wind, followed by shorter periods of strong wind.
Because turbine power curves are nonlinear, annual production can differ.
Therefore WindTurbine.pk’s commercial analysis should preferably examine hourly wind distributions rather than simply reporting:
Average wind speed = 6 m/s.
This same principle is already used in the Wind Turbine for Factory in Karachi guide, where annual energy rather than rated power is treated as the key commercial metric.
19. Next Step: Compare the Turbine With the Factory Hour by Hour
This is where the electricity bill alone reaches its limit.
Ideally obtain:
Dataset 1
8,760 hourly factory load values
Dataset 2
8,760 hourly turbine generation values
Then calculate for every hour:
Example:
| Hour | Factory Load | Wind Generation | Used by Factory | Surplus | Grid Import |
|---|---|---|---|---|---|
| 01:00 | 70 kW | 110 kW | 70 | 40 | 0 |
| 06:00 | 90 | 60 | 60 | 0 | 30 |
| 10:00 | 220 | 80 | 80 | 0 | 140 |
| 14:00 | 250 | 180 | 180 | 0 | 70 |
| 18:00 | 190 | 210 | 190 | 20 | 0 |
| 23:00 | 60 | 130 | 60 | 70 | 0 |
Now we can answer questions the monthly bill cannot:
How much wind electricity will the factory actually consume?
surplus?
grid electricity will remain necessary?
20. Self-Consumption Ratio vs Renewable Coverage
These are different.
Wind self-consumption ratio
Suppose the turbine generates:
500,000 kWh
and the factory directly uses:
425,000 kWh
Then:
Wind contribution to factory consumption
If the factory consumes:
1,185,000 kWh/year
then:
So the same project has:
85% wind self-consumption
but supplies only:
35.9% of annual factory energy
Both numbers are useful, but they answer different questions.
21. Why a 24-Hour Factory Is Different From a Daytime Factory
Suppose two factories both consume:
1,200,000 kWh/year.
Factory A operates:
8 AM–6 PM
Factory B operates:
24 hours/day
If significant wind generation occurs at night, Factory B may be able to directly use more of it.
That could improve project economics.
But do not assume:
“Wind always blows at night.”
That must be demonstrated by the site’s hourly wind data.
This is another reason annual kWh alone cannot determine turbine capacity.
22. Example: Factory Using 100,000 kWh Per Month
Let’s now build a complete screening example.
Factory consumption:
Approximate annual consumption:
Average load:
Suppose management wants wind to provide approximately:
25% of annual consumption.
Target wind energy:
Now compare turbine sizes.
| Turbine | 20% CF | 25% CF | 30% CF | 35% CF |
|---|---|---|---|---|
| 100 kW | 175,200 | 219,000 | 262,800 | 306,600 |
| 150 kW | 262,800 | 328,500 | 394,200 | 459,900 |
| 200 kW | 350,400 | 438,000 | 525,600 | 613,200 |
| 250 kW | 438,000 | 547,500 | 657,000 | 766,500 |
At first glance:
- a 100 kW machine reaches approximately the target only around the 35% scenario;
- a 150 kW machine exceeds it at 25%;
- a 200 kW machine exceeds it at 20%.
But we still cannot choose between them.
Now we need the actual site AEP for real turbine models.
That is the difference between a sizing table and engineering.
23. What If the Factory Wants 50% Wind Energy?
Same factory:
Target:
Required rated capacity:
| Expected CF | Approximate rated capacity required* |
|---|---|
| 15% | 457 kW |
| 20% | 342 kW |
| 25% | 274 kW |
| 30% | 228 kW |
| 35% | 196 kW |
| 40% | 171 kW |
*Before considering project-specific losses and hourly self-consumption/export constraints.
This table demonstrates something extremely important:
The electricity bill tells us the energy target. The wind resource tells us how large the turbine must be to approach that target.
24. What If the Factory Wants 100% Annual Energy From Wind?
For the same 1.2 GWh/year factory:
| CF | Theoretical rated capacity to generate 1.2 GWh/year |
|---|---|
| 15% | 913 kW |
| 20% | 685 kW |
| 25% | 548 kW |
| 30% | 457 kW |
| 35% | 391 kW |
| 40% | 342 kW |
But even if annual wind generation equals:
that does not mean the factory is 100% powered by wind every hour.
At some times:
and at others:
Without sufficient grid interaction, storage or another balancing resource, annual energy matching is not the same as 24/7 energy independence.
This distinction should be clearly explained to every industrial customer.
25. Maximum Demand Still Matters
Although maximum demand should not directly determine turbine capacity, it is still important.
Suppose:
Annual average load = 137 kW
but:
Maximum demand = 500 kW.
That tells us the factory has significant peaks.
Wind generation may reduce some of those peaks—but only if wind happens to be available during those intervals.
Therefore a wind turbine should not automatically be advertised as a guaranteed maximum-demand reduction tool.
To study demand reduction properly, you need interval data.
26. Peak and Off-Peak Units Can Make the Bill More Useful
If the customer’s bill separates peak and off-peak consumption, it gives another useful clue.
For example:
| Consumption | kWh/month |
|---|---|
| Peak | 25,000 |
| Off-peak | 75,000 |
| Total | 100,000 |
Now we know much of the factory’s energy occurs outside peak periods.
But even this is not as useful as 15-minute or hourly load data.
The best commercial dataset is often obtained from:
- smart meter;
- energy management system;
- SCADA;
- utility interval meter;
- factory electrical monitoring.
27. Existing Solar Must Be Included
Many Pakistani factories already have solar.
Suppose a factory consumes:
1.2 GWh/year
but already generates:
500 MWh/year solar.
You cannot size wind as though solar did not exist.
Instead model:
and then compare wind generation with that remaining load.
Otherwise you may create large periods of renewable surplus.
A hybrid analysis should use:
versus:
This is especially important for businesses considering commercial wind alongside an existing rooftop solar plant.
28. Don’t Forget the Transformer
Suppose the analysis suggests a:
500 kW turbine.
Before ordering it, investigate:
- factory supply voltage;
- transformer rating;
- existing load;
- solar generation;
- turbine generator/converter voltage;
- switchgear;
- protection;
- export conditions;
- short-circuit contribution;
- power quality;
- metering.
A technically good wind resource does not automatically mean the existing factory electrical system can accept the proposed generator without modification.
29. Pakistan’s Grid Rules Need to Be Checked at the Time of the Project
This is particularly important in 2026.
NEPRA’s current legal register lists the Prosumer Regulations 2026, originally notified on 9 February 2026, subsequent amendments dated 28 April and 6 August 2026, and the Technical Standards for Grid Connectivity Regulations 2026, notified on 27 April 2026.
Therefore a business should not size a turbine on the assumption that every surplus kWh will automatically receive the same financial treatment as a self-consumed kWh.
The current regulatory route, project capacity, connection voltage, distribution company requirements and applicable export treatment should be confirmed during project development.
30. Size for Useful Energy, Not Maximum Possible Energy
This is an important commercial principle.
Suppose:
Option A — 250 kW
Produces:
550,000 kWh/year
of which:
500,000 kWh is directly useful.
Option B — 500 kW
Produces:
1,000,000 kWh/year
but only:
600,000 kWh is directly useful, with the rest having much lower value or requiring another solution.
The 500 kW turbine produces much more electricity.
That does not automatically mean it produces the better financial return.
You must calculate the value of each energy stream.
31. Financial Value Should Be Calculated Separately
A useful framework is:
Then:
Do not use:
unless every generated kWh genuinely has that same financial value under the project’s arrangement.
32. Example of Turbine Oversizing
Factory annual consumption:
1,200,000 kWh
Candidate 500 kW turbine:
Estimated net generation = 1,300,000 kWh
At first glance:
Perfect—wind production is approximately equal to consumption.
But hourly modelling finds:
Directly self-consumed = 720,000 kWh
Surplus = 580,000 kWh
The turbine may therefore be significantly oversized for a strategy focused primarily on direct self-consumption.
A smaller machine might produce less total energy but achieve a higher self-consumption ratio and potentially stronger economics.
This is why:
Annual kWh matching is only the first level of sizing. Hourly matching is the better level.
33. How Much Wind Speed Does the Factory Need?
There is no single universal minimum wind speed that makes every turbine economical.
Why?
Because turbines differ in:
- rotor diameter;
- hub height;
- specific power;
- power curve;
- CAPEX;
- O&M;
- design class.
And projects differ in electricity value.
The useful question is:
At the measured wind distribution at this hub height, what net AEP will this exact turbine produce?
That answer can then be converted into PKR/kWh and investment returns.
34. Rotor Diameter Matters When Comparing Same-kW Turbines
Suppose two suppliers offer:
100 kW turbine A
and:
100 kW turbine B.
They may have very different rotor diameters.
Rotor swept area is:
A larger rotor intercepts more air.
This is why turbine procurement should compare:
| Specification | Supplier A | Supplier B |
|---|---|---|
| Rated power | 100 kW | 100 kW |
| Rotor diameter | ? | ? |
| Swept area | ? | ? |
| Hub height | ? | ? |
| Power at 5 m/s | ? | ? |
| Power at 6 m/s | ? | ? |
| Power at 7 m/s | ? | ? |
| Rated wind speed | ? | ? |
| Cut-out speed | ? | ? |
| IEC/certification | ? | ? |
| Estimated site AEP | ? | ? |
| Warranty | ? | ? |
| O&M support | ? | ? |
The final row—site AEP—is usually much more commercially meaningful than rated kW alone.
35. Practical Factory Sizing Framework
A useful preliminary framework for WindTurbine.pk customers is:
| Factory annual electricity use | Wind contribution target | What to do next |
|---|---|---|
| <100 MWh | 20–40% | Investigate small commercial turbine |
| 100–500 MWh | 20–40% | Compare 10–100 kW class options |
| 500 MWh–1 GWh | 20–50% | Compare approximately 50–250 kW options |
| 1–3 GWh | 20–50% | Compare approximately 100–500 kW options |
| 3–10 GWh | 20–50% | Investigate 250 kW–1 MW class |
| >10 GWh | Site/project dependent | Utility-style commercial assessment |
These are screening ranges, not turbine recommendations. Actual turbine capacity can fall outside them depending on wind resource, load shape and equipment.
36. Pakistan Location Matters as Much as the Electricity Bill
Consider three factories all consuming:
1,000,000 kWh/year.
Factory A — Jhimpir/open site
Good documented regional wind resource and open exposure.
Factory B — Karachi industrial area
Coastal wind may be useful, but warehouses and buildings can create substantial turbulence.
Factory C — Inland low-wind location
Large electricity consumption but weak wind resource.
The electricity bills could be identical.
The correct turbine decision could be completely different.
This is why WindTurbine.pk’s existing Karachi factory wind-turbine guide emphasizes annual energy production and exact site conditions rather than matching turbine kW directly to factory demand.
For projects extending through Sindh’s industrial belt, see Wind Turbine for Business from Karachi to Hyderabad.
37. What Documents Should the Factory Send for Initial Sizing?
A customer asking:
“What size wind turbine do I need?”
should ideally provide:
| Required information | Purpose |
|---|---|
| 12 months electricity bills | Annual/seasonal consumption |
| Peak & off-peak units | Time-of-use analysis |
| Maximum demand | Electrical sizing context |
| 15-minute/hourly load data | Accurate self-consumption modelling |
| Exact GPS coordinates | Wind-resource screening |
| Factory operating hours | Load profile |
| Existing solar kW | Hybrid modelling |
| Solar generation data | Net-load calculation |
| Transformer rating | Electrical assessment |
| Supply voltage | Interconnection |
| Site plan | Turbine placement |
| Available open land | Tower/foundation |
| Building heights | Turbulence/wake |
| Nearby obstacles | Micro-siting |
| Site photographs | Preliminary assessment |
| Expansion plans | Future load |
With only one electricity bill, we can make a rough screening estimate.
With all of the above, we can begin a proper commercial feasibility assessment.
38. WindTurbine.pk’s Recommended Sizing Process
For commercial customers, the process should be:
Stage 1 — Electricity bill analysis
Calculate:
annual kWh + monthly variation + maximum demand + TOU consumption
↓
Stage 2 — Factory load analysis
Obtain:
hourly or 15-minute demand
↓
Stage 3 — GPS wind screening
Use independent long-term wind resources.
↓
Stage 4 — Hub-height analysis
Estimate or measure wind at the proposed turbine height.
↓
Stage 5 — Wind direction and obstacles
Check:
buildings + trees + tanks + chimneys + terrain
↓
Stage 6 — On-site wind measurement
For larger investments, determine whether a met mast, LiDAR or other professional measurement campaign is warranted.
↓
Stage 7 — Turbine shortlist
Compare:
rotor + power curve + tower + certification + service
↓
Stage 8 — AEP
Calculate:
gross annual kWh
↓
Stage 9 — Losses and uncertainty
Estimate:
net AEP + uncertainty
↓
Stage 10 — Hourly load matching
Calculate:
self-consumed kWh + surplus kWh + remaining grid import
↓
Stage 11 — Electrical and civil engineering
Check:
transformer + protection + grid + tower + soil + foundation
↓
Stage 12 — Financial model
Calculate:
CAPEX + OPEX + savings + LCOE + NPV + IRR + payback
↓
Stage 13 — Final turbine size
Only now select the turbine.
That sequence prevents the most common commercial mistake:
Buying the turbine first and trying to make the site fit it afterwards.
39. Quick Worked Example
Consider a Pakistan factory with:
| Parameter | Value |
|---|---|
| Monthly electricity | ~100,000 kWh |
| Annual electricity | 1,200,000 kWh |
| Average load | ~137 kW |
| Maximum demand | 300 kW |
| Operation | 24 hours |
| Wind target | 30% annual energy |
| Target wind generation | 360,000 kWh/year |
Now suppose preliminary wind modelling gives three candidate turbines:
| Candidate | Net AEP | Direct self-consumption | Surplus |
|---|---|---|---|
| 100 kW | 260,000 kWh | 250,000 | 10,000 |
| 150 kW | 370,000 | 340,000 | 30,000 |
| 250 kW | 610,000 | 490,000 | 120,000 |
If management’s target is approximately:
360,000 kWh/year
the 150 kW option looks interesting from an energy perspective.
But it is still not automatically the winner.
Now compare:
- installed CAPEX;
- O&M;
- turbine life;
- warranty;
- export value;
- foundation;
- tower;
- electrical modifications;
- financing;
- NPV;
- IRR;
- LCOE.
Only then can the business make an informed investment decision.
40. Five Numbers That Should Be on Every Commercial Wind Proposal
A supplier’s proposal should not stop at:
Turbine = 250 kW
Ask for these five numbers:
| Number | Why it matters |
|---|---|
| 1. Factory annual consumption — kWh/year | Defines demand |
| 2. Net turbine AEP — kWh/year | Defines expected production |
| 3. Self-consumed wind — kWh/year | Defines useful onsite energy |
| 4. Total installed CAPEX — PKR | Defines investment |
| 5. LCOE / NPV / IRR / payback | Defines economics |
And every energy number should state its assumptions.
41. Questions to Ask Before Accepting a Turbine Recommendation
If someone looks at your electricity bill and immediately says:
“You need a 500 kW turbine,”
ask:
What wind data did you use?
At what height?
Which turbine power curve?
How much will be surplus?
How was the current Pakistan grid/export arrangement treated?
What is total installed cost rather than turbine-only price?
If these questions cannot be answered, the turbine has not really been sized yet.
42. The Simple Rule for Pakistani Factory Owners
Your electricity bill tells you:
Your wind assessment tells you:
The turbine power curve tells you:
Your hourly load profile tells you:
And the financial model tells you:
All five are required.
Final Conclusion
A factory electricity bill is an excellent starting point for wind-turbine sizing, but it should never be the only input.
For a Pakistani business, the professional method is to first calculate 12-month electricity consumption, maximum demand and time-of-use consumption. Then analyse the exact factory’s wind resource at the proposed hub height, obtain a credible turbine power curve, calculate annual energy production, and compare the resulting wind generation with the factory’s load hour by hour.
A factory consuming 1.2 million kWh per year might ultimately justify a 100 kW turbine, a 250 kW turbine, a 500 kW turbine—or no wind turbine at all.
The answer depends on the site.
Pakistan has proven wind resources, particularly in Sindh’s established wind-development regions, and government and international datasets provide strong tools for preliminary screening.
But the commercial decision should always come down to:
—not simply the kW number printed on the electricity bill.
For businesses beginning this process, use WindTurbine.pk Wind Feasibility, review Wind Turbine Prices from 1 kW to 100 kW in Pakistan, and continue with Wind Turbines for Business in Pakistan: 100 kW to 1 MW. For Karachi projects specifically, the Wind Turbine for Factory in Karachi guide explains how location, wind speed, output and ROI interact. Wind turbine Price in Pakistan Wind Turbine Price in Pakistan